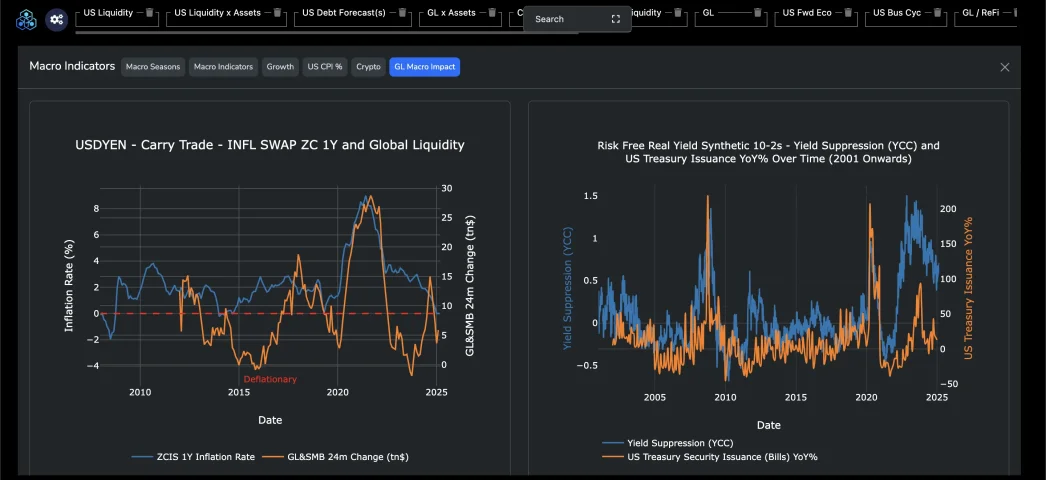
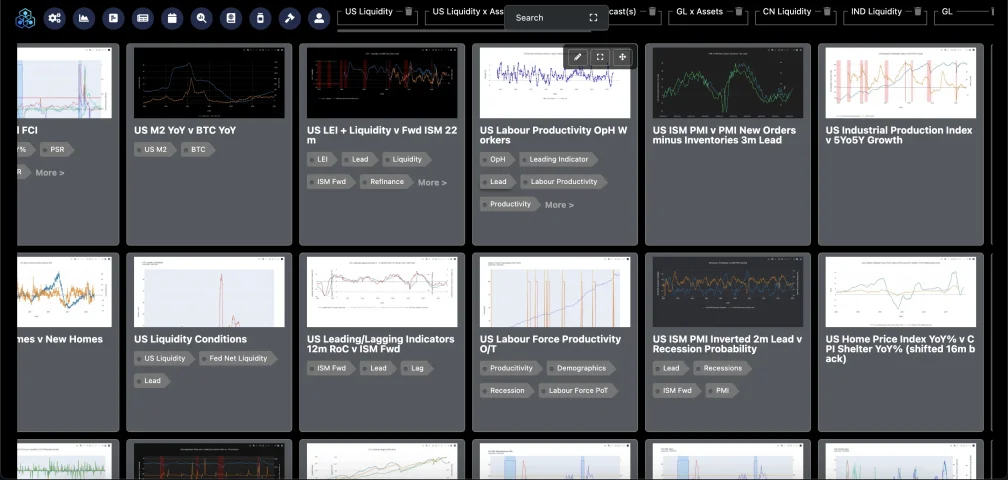
We have a internal system, over the past year been trying to make it accessible front end (external) - getting there - so these above are the external representations - slightly less technical etc but does the same job.are these tools something you developed internally in your company @wellington ?
You are using an out of date browser. It may not display this or other websites correctly.
You should upgrade or use an alternative browser.
You should upgrade or use an alternative browser.
Total return by asset for last 200 years
- Thread starter uranium
- Start date
this one yeah?Source: "Stocks for the Long Run" by Jeremy Siegel.
https://www.amazon.com/Stocks-Long-Run-Definitive-Investment/dp/0071800514
Thank for sharing. I was wondering if you posted any recent charts?Now for those that still wish to believe in the fairy tale of free-markets and it's all driven by wild productivity that can not be surmised, guessed, predicted pre-emptively.
(US Stocks)
US Consumer Price Index (CPI) - 1990 (this was technically the first cross over period) vs 6 Months annualised % change .... looks random right. View attachment 6874
Now look at US PPI Minus CPI vs Corporate Profits after Tax.
Oh that's weird - they are synchronised... hmmmmmm...
View attachment 6875
Well, PPI lags CPI, & CPI is a lagging impact on the markets and led by the business cycle and as we can see business cycle profits minus taxes follows PPI, and all of these follow the ISM in a manner of speaking, the ISM... therefore is the next area you need to peruse.
Observe ISM (US ISM Follows China Credit Liquidity Impulse by 6 months - and follows Global Liquidity by roughly 15-18 months) -> but CB Liquidity takes 52 weeks to hit Global Liquidity -> then from there weeks to months into the markets.
Note 2018 onwards... that was the last breakage in the system (2018/19 rate hike attempt).
View attachment 6878
Global Liquidity Cycles
View attachment 6879
Correlation between Central Bank Value (FED) and Nasdaq (= Nasdaq is lifted by Fed Balance Sheet) -> Fed tightens to pull in funds to roll over debts every X yrs to service the interest at a lower rate i.e it crowds out the markets to pull in liquidity -> hence pull backs Nasdaq etc (mentioned above) time those periods against rate hikes you have your answer, then observe liquidity flows.
View attachment 6880
G7 as synchronised (they all follow papa bear). oh look you can clearly see the future... you can also show the past, as ISM leads... you know where the markets go in the future as the inverted value as its all re-financing provides a path to a cycle of the past and the future....
View attachment 6881
Now you can go into the US Markets specifically ISM, PMI's vrs their respected Inverted -> then tie up against volatility in NDX -> you know where that's going based on liquidity, inverted.
View attachment 6882View attachment 6883View attachment 6884View attachment 6885View attachment 6886
When you have all that figured out, for every $ position against debasement you take (essentially against Goverments) you’ll be able to hundreds to thousands without leverage by leveraging the risk curve in assets against greed in the market cycles, liquidity cycles and tightening cycles.
You therefore premptive know what assets, what entry zone and what exit zone.
And at that point 8,16,50% growth in a year becomes dull - and you only want that as residual store of value assets that are deflationary whilst your main allocation adds to it every cycle.
You can access them all online as they were open-sourced and put into a bigger system.Thank for sharing. I was wondering if you posted any recent charts?
https://tinyurl.com/4m4u7cye


Stocks have always been the best for long term investments and especially if you have 5 or 10 years!
This is entirely false. The S&P500 has been flat against monetary inflation, but has grown by ~8/12% annually.Stocks have always been the best for long term investments and especially if you have 5 or 10 years!
Nasdaq has outperformed monetary inflation but underperformed when factoring in taxe(s).
Theres such a thing as real growth and nominal growth, number go up doesn't mean = real growth.
Do you have any official diagram, graph, or something that supports what you're saying?
What I’ve seen from my bank doesn’t align with what you're stating.
Now I'm curios
What I’ve seen from my bank doesn’t align with what you're stating.
Now I'm curios
Nominal Growth isn't real Growth.Do you have any official diagram, graph, or something that supports what you're saying?
What I’ve seen from my bank doesn’t align with what you're stating.
Now I'm curios
In real terms the following
Debasement (Monetary Inflation) not inflation is avg 8% plus variable inflation 2/4% plus what ever taxes = your wealth hurdle, anything under-performing that is real world loss.
As for charts or rather real substantiated data, yes you can track monetary inflation real time with Crossborder Capital (5k a month), Capital Wars (750$ a year - but delayed monthly / weekly data), Bloomberg Terminal 25k a year, or terminal Catena (300$ but weekly data under their global liquidity tracking system).
Stocks have always been the best for long term investments and especially if you have 5 or 10 years!
I would say more 20years+
Anything under 10 years is a relatively short timeframe in the stock market.
So how do you actually go about beating that total wealth hurdle in practice? What kind of assets or strategies are realistically capable of outperforming monetary debasement, price inflation, and taxes combined?Nominal Growth isn't real Growth.
In real terms the following
Debasement (Monetary Inflation) not inflation is avg 8% plus variable inflation 2/4% plus what ever taxes = your wealth hurdle, anything under-performing that is real world loss.
As for charts or rather real substantiated data, yes you can track monetary inflation real time with Crossborder Capital (5k a month), Capital Wars (750$ a year - but delayed monthly / weekly data), Bloomberg Terminal 25k a year, or terminal Catena (300$ but weekly data under their global liquidity tracking system).
Similar threads
- Replies
- 25
- Views
- 3,151
- Replies
- 3
- Views
- 951
- Replies
- 15
- Views
- 957
- Replies
- 10
- Views
- 895
Share:
Latest Threads
-
Moving Outside EU, but where?
- Started by Ani
- Replies: 19
-
Zero-Tax Strategy for Perpetual Traveler: Crypto Income, Offshore Banking, and Land Investments ?
- Started by WormCasting
- Replies: 8
-
WANTED: FCA Broker company, MSB in Canada, SPI in Poland for corporate clients
- Started by Yan Kunichkin
- Replies: 0
-
Dubai company in IT/Trading/Wholesale with FAB account opened needed fast
- Started by Yan Kunichkin
- Replies: 2
